
Creating a new HTML reporter for Newman has been a wonderful learning experience – I’ve managed to bring together several different skills, some that I had knowledge of already and many that I actually taught myself, by failing lots, as I moved through the development process.
The biggest thing that I took away from all this was the fact that I really suck at designing and styling reports. Personally, I don’t think it’s that bad and it could have been a lot worse.


The new reporter needed to have a ‘default’ template, this was to ensure that it can work out of the box once it’s either been installed globally or part of a project. With it being the default, it’s not going to be to everyone’s taste – This might not be just to do with the style or the navigation, it might also be the level of detail on the report.
I’ve had numerous bit’s of awesome feedback about the report and suggestions for different things that could be improved. I’ve made many changes off the back of this feedback but I’ve stopped short of changing everything suggested.
The beauty of the HTML reporters is that you can supply your own custom templates and create more meaningful reports that suit your own context, the underlying data from the Newman summary object, is the same for each. The way that you choose to display this is open to your own personal taste and requirements.
I often reply to people with something worded similar to the paragraph above, I love that people want to download and use something that I’ve created, it makes me feel awesome but I’m not forcing anyone to just use the template that I’ve created.
This got me thinking though, creating a template to me is easy-ish but I’m suggesting to people that are not me, to just go and create one. This is not actually very helpful of me and I love to help people…
I wanted to just explain the basics of getting data from Newman and render this on a HTML page – This is not going to be in-depth and you’re not going to be a template creating ninja as a result but at least you can increase your own understanding about how it all pins together.
This reporter and all the other Newman HTML reporters that I have seen, uses a template engine called Handlebars – There are many template engines for JavaScript that do a similar thing but this is the one currently used in the reporters.
How do we get the Newman data onto a HTML page?
First off we need to create a new file, in your favourite text editor, with a `.hbs` file extension. This will be the filename that we will be referencing, when we run Newman from the command line or within a script.
The file can contain something like this for now, this is just for demo purposes to add some structure to the page.

The Newman Summary is a JSON object which contains all the details relating to the collection run. Using the Handlebars syntax we are able to reference different parts of the summary object in our template page and render these values, from the data, on our final report.
The Handlebars library contains lots of different options but I’m only going to run through a couple to explain what’s happening with the data – Once you’re happy, you can go and explore all the other options open to you.
I’ve taken a sample of the data, the whole object can be quite verbose and displaying the whole thing will be confusing so this sample set will be fine for now. I’ll add a link to a full sample, at the bottom of the post.
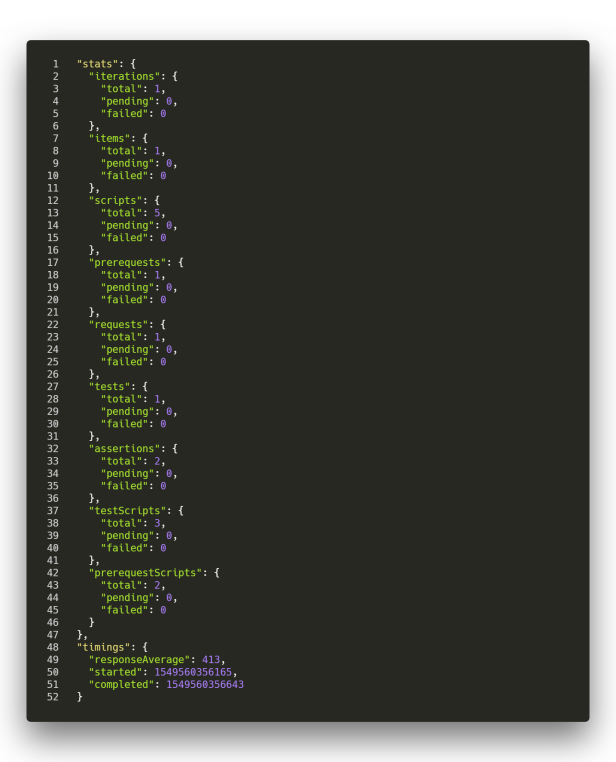
Above, we have the stats and the timings data for the test run, we’re going to use the {{#}} and {{/}} block expressions on our template to help us render those values on the report. The whole object is the summary, so using the with helper, we create a {{#with summary}} block to tell Handlebars that we want to use that part of the data.
Each time you open a block expression, you need to remember to close it out again using the name of the helper, on this occasion it’s {{/with}}. So now we have the summary block, we need do the same again to reference the data within the stats object.
From here, we can start to directly reference parts of the data – I want to render the ‘total’ and ‘failed’ values from the iterations, requests, prerequestScripts and testScripts. Each name is the same as the key in the sample data set above.

Let’s run Newman with our basic template…
We are now in a position to run the a Postman Collection using Newman, we’ll be running this from the terminal but we could also create a nodejs script, to do the same thing.
Ensure that you have both the newman and newman-reporter-htmlextra npm modules globally installed.
npm install – g newman newman-reporter-htmlextra
To run the collection, you can use the following command:
newman run -r htmlextra –reporter-htmlextra-export ./report.html –reporter-htmlextra-template ./handlebars.hbs
By using the –reporter-htmlextra-template flag and giving it the path to the template file, the reporter will now use this to create the report. By default, if you do not supply an export location, it will create a ./newman directory for you and add all the newly created reports in here. Specifying the export location and the report name, will give you a far better level of control.
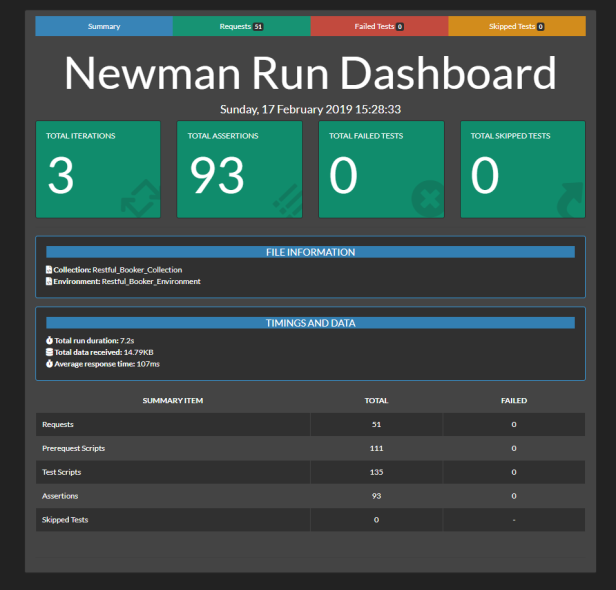
Once the test run has completed, It will create a very unimpressive looking report – My default template is not looking too bad now… 🙂

Obviously, that’s not going to win any style awards but it’s just giving you a feel for how the data will be rendered on a browser window, from the reference points in the template.
As the template is basically a static HTML page, we can add the standard HTML elements/tags to it and add a tiny level of formatting to the report.
For this example, I’ve created a basic`table` and added some CSS to place a border around it.


There are other standard Handlebar helpers available for us to use that might be familiar to you, if you’ve coded in any programming language – The each helper will give us the ability to loop through an array and render each value on the report.
This is very useful for extracting the data from each of the individual requests in the collections or like I’m doing here, each of the failures.
There are a few of things happening here and I wanted to provide a short example of using different helpers as well as adding some logic into the mix, that will display certain things depending on the data set.

I’ve `wrapped` everything in an {{#if}} {{/if}} block, by doing this I’m controlling the data that’s rendered on the report.
If we don’t have any failures during the test run, we don’t really want to display an empty set of headings on the final report – I’ve achieved this by checking the failures array using the summary.failures.length condition. If the array contains any failures it will use that data to `fill` all the reference points.
Coupled with this is the {{#each}} {{/each}} block, this expression will just loop through the array and grab the data required from each of the objects. This could iterate/loop over 1 object or a 1000+ objects.
The Newman test run for this example, had 2 failures in the array, so we looped through those objects and extracted the values from the reference points, that we specified in the template code above.
This resulted in the report that you can see below. Still no very ‘pretty’ but you can see the data coming through and it’s the start of making a beautiful report 🙂

Lastly, something I didn’t mention was the use of the {{#gt}} {{else}} {{/gt}} block expression. The `gt` condition means ‘greater than’, I use this quite a lot to change certain elements on the report.
In this case, I’ve used it to change the text in the title to help pluralise the sentence. It frustrates me when I see websites that have labels like ‘1 failures’ or ‘3 failure(s)’ – By controlling which text is used based on the number in the {{#gt}} condition, I don’t have to compromise and display the incorrect label.
Making things look less boring…
There are lots of frameworks out there that can help you create a styled web page relatively quickly, my ‘go to’ has always been Bootstrap and it’s been awesome. The framework comes packed full of classes that, once the framework is referenced in the file, allow you to provide different styles to all the HTML elements on the report.

I’ve added the code block here so that, If you wanted too, you could paste this into your .hbs file and create the same thing locally with the newman-reporter-htmlextra module.
This file contains bidirectional Unicode text that may be interpreted or compiled differently than what appears below. To review, open the file in an editor that reveals hidden Unicode characters.
Learn more about bidirectional Unicode characters
| <html> | |
| <head> | |
| <title>My Awesome Template</title> | |
| <link rel="stylesheet" href="https://stackpath.bootstrapcdn.com/bootstrap/4.1.3/css/bootstrap.min.css"> | |
| <script src="https://stackpath.bootstrapcdn.com/bootstrap/4.1.3/js/bootstrap.min.js"></script> | |
| </head> | |
| <body> | |
| <div class="container"> | |
| <div class="table-responsive"> | |
| <table class="table table-striped table-bordered"> | |
| <thead class="thead-inverse"> | |
| <tr class="text-center"> | |
| <th class="text-uppercase">Summary Item</th> | |
| <th class="text-uppercase">Total</th> | |
| <th class="text-uppercase">Failed</th> | |
| </tr> | |
| </thead> | |
| <tbody> | |
| {{#with summary.stats}} | |
| <tr> | |
| <td>Requests</td> | |
| <td class="text-center">{{requests.total}}</td> | |
| <td class="text-center">{{requests.failed}}</td> | |
| </tr> | |
| <tr> | |
| <td>Prerequest Scripts</td> | |
| <td class="text-center">{{prerequestScripts.total}}</td> | |
| <td class="text-center">{{prerequestScripts.failed}}</td> | |
| </tr> | |
| <tr> | |
| <td>Test Scripts</td> | |
| <td class="text-center">{{testScripts.total}}</td> | |
| <td class="text-center">{{testScripts.failed}}</td> | |
| </tr> | |
| {{/with}} | |
| {{#with summary}} | |
| <tr class="{{#gt failures.length 0}}table-danger{{/gt}}"> | |
| <td>Assertions</td> | |
| <td class="text-center">{{totalTests stats.assertions.total skippedTests.length}}</td> | |
| <td class="text-center">{{stats.assertions.failed}}</td> | |
| </tr> | |
| <tr class="{{#gt skippedTests.length 0}}table-warning{{/gt}}"> | |
| <td>Skipped Tests</td> | |
| <td class="text-center">{{#gt skippedTests.length 0}}{{skippedTests.length}}{{else}}0{{/gt}}</td> | |
| <td class="text-center">-</td> | |
| </tr> | |
| {{/with}} | |
| </tbody> | |
| </table> | |
| </div> | |
| </div> | |
| </body> | |
| </html> |
This template example is quite basic and is using some of the bootstrap classes to change things like the header text to uppercase, the text alignment, the ‘danger’ colour in the table cell for the failed assertions etc.
You may have seen this line {{totalTests stats.assertions.total skippedTests.length}} in the template. When I created the new reporter, I wanted to add in some additional helpers to the Handlerbars engine, you have the ability to register helpers that will assist you to display the data in a certain way.
I added the totalTests handler so that the total number of assertions takes into account the number of skipped tests, that there may have been during the run. The helper does a simple calculation on the values passed in to it and renders the correct data on the report.
Adding lots of different bespoke handlers is time consuming, luckily for me, someone has taken that pain away and has created an extensive list of handlebar helpers, these have all been included in the new reporter so you can use anything in that module, to help you create some beautiful looking and more meaningful reports, with far little effort.
Bootstrap is not the only framework out there – Bulma is also something that can be used in the template. This is well worth checking out, I plan on creating more report templates using this framework and give the users a better selection of ones to use in the reporter and not just be stuck using the default one.
This is an example of just a standard Newman Summary object that is similar to the one that would be used to extract different pieces of the data and render these on a report.
This file contains bidirectional Unicode text that may be interpreted or compiled differently than what appears below. To review, open the file in an editor that reveals hidden Unicode characters.
Learn more about bidirectional Unicode characters
| { | |
| "cursor": { | |
| "position": 0, | |
| "iteration": 0, | |
| "length": 1, | |
| "cycles": 1, | |
| "empty": false, | |
| "eof": false, | |
| "bof": true, | |
| "cr": false, | |
| "ref": "bd083954-07e2-446e-bb70-69da2da31fb4" | |
| }, | |
| "summary": { | |
| "collection": { | |
| "_": { | |
| "postman_id": "23b98424-d2c0-4c7d-800e-0bd841eb8495" | |
| }, | |
| "item": [ | |
| { | |
| "id": "0da45a06-a755-4b19-b1bf-5951ec03c449", | |
| "name": "Simple GET Request", | |
| "request": { | |
| "url": { | |
| "protocol": "https", | |
| "path": [ | |
| "posts" | |
| ], | |
| "host": [ | |
| "jsonplaceholder", | |
| "typicode", | |
| "com" | |
| ], | |
| "query": [], | |
| "variable": [] | |
| }, | |
| "method": "GET", | |
| "body": {} | |
| }, | |
| "response": [], | |
| "event": [ | |
| { | |
| "listen": "test", | |
| "script": { | |
| "id": "9e34f1b9-b071-4bbc-b033-14912e39fdd8", | |
| "type": "text/javascript", | |
| "exec": [ | |
| "pm.test(\"Status code is 200\", function () {", | |
| " pm.response.to.have.status(200);", | |
| "});", | |
| "", | |
| "pm.test(\"Response time is less than 200ms\", function () {", | |
| " pm.expect(pm.response.responseTime).to.be.below(200);", | |
| "});" | |
| ], | |
| "_lastExecutionId": "0e68fabd-3f30-49d5-9afe-009e11490f6b" | |
| } | |
| } | |
| ] | |
| } | |
| ], | |
| "event": [], | |
| "variable": [], | |
| "info": { | |
| "_postman_id": "23b98424-d2c0-4c7d-800e-0bd841eb8495", | |
| "name": "Demo Collection", | |
| "schema": "https://schema.getpostman.com/json/collection/v2.1.0/collection.json" | |
| } | |
| }, | |
| "environment": { | |
| "id": "7e020029-b23d-40a3-9fb6-280a7bc93e93", | |
| "values": [] | |
| }, | |
| "globals": { | |
| "id": "f267c3f2-0ed2-451f-8b2e-f02fd133ec06", | |
| "values": [] | |
| }, | |
| "run": { | |
| "stats": { | |
| "iterations": { | |
| "total": 1, | |
| "pending": 0, | |
| "failed": 0 | |
| }, | |
| "items": { | |
| "total": 1, | |
| "pending": 0, | |
| "failed": 0 | |
| }, | |
| "scripts": { | |
| "total": 1, | |
| "pending": 0, | |
| "failed": 0 | |
| }, | |
| "prerequests": { | |
| "total": 1, | |
| "pending": 0, | |
| "failed": 0 | |
| }, | |
| "requests": { | |
| "total": 1, | |
| "pending": 0, | |
| "failed": 0 | |
| }, | |
| "tests": { | |
| "total": 1, | |
| "pending": 0, | |
| "failed": 0 | |
| }, | |
| "assertions": { | |
| "total": 2, | |
| "pending": 0, | |
| "failed": 0 | |
| }, | |
| "testScripts": { | |
| "total": 1, | |
| "pending": 0, | |
| "failed": 0 | |
| }, | |
| "prerequestScripts": { | |
| "total": 0, | |
| "pending": 0, | |
| "failed": 0 | |
| } | |
| }, | |
| "timings": { | |
| "responseAverage": 89, | |
| "responseMin": 89, | |
| "responseMax": 89, | |
| "responseSd": 0, | |
| "dnsAverage": 0, | |
| "dnsMin": 0, | |
| "dnsMax": 0, | |
| "dnsSd": 0, | |
| "firstByteAverage": 0, | |
| "firstByteMin": 0, | |
| "firstByteMax": 0, | |
| "firstByteSd": 0, | |
| "started": 1556096542737 | |
| }, | |
| "executions": [ | |
| { | |
| "cursor": { | |
| "position": 0, | |
| "iteration": 0, | |
| "length": 1, | |
| "cycles": 1, | |
| "empty": false, | |
| "eof": false, | |
| "bof": true, | |
| "cr": false, | |
| "ref": "f3fc4502-5221-4574-a2dc-126888377ac1", | |
| "httpRequestId": "f66f4935-10f8-4ef2-8105-f43f4882c481" | |
| }, | |
| "item": { | |
| "id": "0da45a06-a755-4b19-b1bf-5951ec03c449", | |
| "name": "Simple GET Request", | |
| "request": { | |
| "url": { | |
| "protocol": "https", | |
| "path": [ | |
| "posts" | |
| ], | |
| "host": [ | |
| "jsonplaceholder", | |
| "typicode", | |
| "com" | |
| ], | |
| "query": [], | |
| "variable": [] | |
| }, | |
| "method": "GET", | |
| "body": {} | |
| }, | |
| "response": [], | |
| "event": [ | |
| { | |
| "listen": "test", | |
| "script": { | |
| "id": "9e34f1b9-b071-4bbc-b033-14912e39fdd8", | |
| "type": "text/javascript", | |
| "exec": [ | |
| "pm.test(\"Status code is 200\", function () {", | |
| " pm.response.to.have.status(200);", | |
| "});", | |
| "", | |
| "pm.test(\"Response time is less than 200ms\", function () {", | |
| " pm.expect(pm.response.responseTime).to.be.below(200);", | |
| "});" | |
| ], | |
| "_lastExecutionId": "0e68fabd-3f30-49d5-9afe-009e11490f6b" | |
| } | |
| } | |
| ] | |
| }, | |
| "request": { | |
| "url": { | |
| "protocol": "https", | |
| "path": [ | |
| "posts" | |
| ], | |
| "host": [ | |
| "jsonplaceholder", | |
| "typicode", | |
| "com" | |
| ], | |
| "query": [], | |
| "variable": [] | |
| }, | |
| "header": [ | |
| { | |
| "key": "User-Agent", | |
| "value": "PostmanRuntime/7.11.0", | |
| "system": true | |
| }, | |
| { | |
| "key": "Accept", | |
| "value": "*/*", | |
| "system": true | |
| }, | |
| { | |
| "key": "Cache-Control", | |
| "value": "no-cache", | |
| "system": true | |
| }, | |
| { | |
| "key": "Postman-Token", | |
| "value": "f353da91-8582-4b7d-ba2f-6df59ae72352", | |
| "system": true | |
| }, | |
| { | |
| "key": "Host", | |
| "value": "jsonplaceholder.typicode.com", | |
| "system": true | |
| }, | |
| { | |
| "key": "accept-encoding", | |
| "value": "gzip, deflate", | |
| "system": true | |
| }, | |
| { | |
| "key": "Connection", | |
| "value": "keep-alive", | |
| "system": true | |
| } | |
| ], | |
| "method": "GET", | |
| "body": {} | |
| }, | |
| "response": { | |
| "id": "725409e4-f2aa-4a67-8b8e-13bf71176323", | |
| "status": "OK", | |
| "code": 200, | |
| "header": [ | |
| { | |
| "key": "Date", | |
| "value": "Wed, 24 Apr 2019 09:02:22 GMT" | |
| }, | |
| { | |
| "key": "Content-Type", | |
| "value": "application/json; charset=utf-8" | |
| }, | |
| { | |
| "key": "Transfer-Encoding", | |
| "value": "chunked" | |
| }, | |
| { | |
| "key": "Connection", | |
| "value": "keep-alive" | |
| }, | |
| { | |
| "key": "Set-Cookie", | |
| "value": "__cfduid=d9f98a699fa338b00c9745fda3a77fc3c1556096542; expires=Thu, 23-Apr-20 09:02:22 GMT; path=/; domain=.typicode.com; HttpOnly" | |
| }, | |
| { | |
| "key": "X-Powered-By", | |
| "value": "Express" | |
| }, | |
| { | |
| "key": "Vary", | |
| "value": "Origin, Accept-Encoding" | |
| }, | |
| { | |
| "key": "Access-Control-Allow-Credentials", | |
| "value": "true" | |
| }, | |
| { | |
| "key": "Cache-Control", | |
| "value": "public, max-age=14400" | |
| }, | |
| { | |
| "key": "Pragma", | |
| "value": "no-cache" | |
| }, | |
| { | |
| "key": "Expires", | |
| "value": "Wed, 24 Apr 2019 13:02:22 GMT" | |
| }, | |
| { | |
| "key": "X-Content-Type-Options", | |
| "value": "nosniff" | |
| }, | |
| { | |
| "key": "Etag", | |
| "value": "W/\"6b80-Ybsq/K6GwwqrYkAsFxqDXGC7DoM\"" | |
| }, | |
| { | |
| "key": "Content-Encoding", | |
| "value": "gzip" | |
| }, | |
| { | |
| "key": "Via", | |
| "value": "1.1 vegur" | |
| }, | |
| { | |
| "key": "CF-Cache-Status", | |
| "value": "HIT" | |
| }, | |
| { | |
| "key": "Expect-CT", | |
| "value": "max-age=604800, report-uri=\"https://report-uri.cloudflare.com/cdn-cgi/beacon/expect-ct\"" | |
| }, | |
| { | |
| "key": "Server", | |
| "value": "cloudflare" | |
| }, | |
| { | |
| "key": "CF-RAY", | |
| "value": "4cc6e5e098d534b8-LHR" | |
| } | |
| ], | |
| "stream": { | |
| "type": "Buffer", | |
| "data": [] | |
| }, | |
| "cookie": [], | |
| "responseTime": 89, | |
| "responseSize": 27520 | |
| }, | |
| "id": "0da45a06-a755-4b19-b1bf-5951ec03c449", | |
| "assertions": [ | |
| { | |
| "assertion": "Status code is 200", | |
| "skipped": false | |
| }, | |
| { | |
| "assertion": "Response time is less than 200ms", | |
| "skipped": false | |
| } | |
| ] | |
| } | |
| ], | |
| "transfers": { | |
| "responseTotal": 27520 | |
| }, | |
| "failures": [], | |
| "error": null | |
| } | |
| } | |
| } |

Congratulations!! Just a quick question: given a json as a result from a previous execution of newman (reporter as json), is it possible to get an html with this plugin? Maybe it is a good improvement, isnt it?
Thanks for the comments. The output of that reporter is slightly different to the output of the htmlextra reporter so it couldn’t be directly mapped.
You can still create a report from that JSON but it would need a different reporter or new script to achieve it.
Hi! Very cool article! I try htmlextra with default dashboard-but i see report in this strange style! Pls see https://prnt.sc/s826hz Tell me please – what could be the reason?
Hey,
That’s looks like it’s not loading the CSS correctly – Which version are you using? Is this still happening for you on the latest version?
I suspect this is an environment issue on your side or the rest of the users would be reporting this issue.
I love your sample “Newman Summary object” that you show above. Any chance you could show one that details out the Failures objects?
Hey Kathy,
You should be able to get that for yourself if you create a tiny node script and bring in Newman as a library:
const newman = require('newman'),
      fs = require('fs');

newman.run({
  collection: 'Collection'
}).on('done', function (error, args) {
    fs.writeFile('./results.json', JSON.stringify(args, null, 2), (err) => {
      if (err) throw err;
      console.log('The file has been saved!');
    });
})
If your Collection contains a test failure, it will be seen in the failures array.
Thanks so much! That was exactly what I needed.
Another question: Do you know of a way to return a portion of an item? For instance, I would like to just return the first 150 characters of the error.message object. Is there an option like substring? Thanks for your help!
Hi Danny,
I have a MacBook Pro.
The htmlextra works fine with the Newman command line.
When I try running Newman with htmlextra in a JavaScript, it doesn’t work and get error
could not find “htmlextra” reporter ensure that the reporter is installed in the same directory as newman
I checked the node_modes and I see both Newman and Newman-reporter-htmlextra.
I tried installing and uninstalling.
I am installing your latest version.
Not sure why htmlextra works on the Newman command line but not in JavaScript.
Thanks,
Dan
The
I’m not really sure what you mean by ‘in JavaScript’ – Without an example of what you’re doing/using I can’t really help. 😢
The best place to ask questions about the reporter is over on the projects github repo, feel free to raise an issue or start a discussion and I will try and answer your questions. 😁